Charts, Tables, Export & Apps
A. Charts and Tables
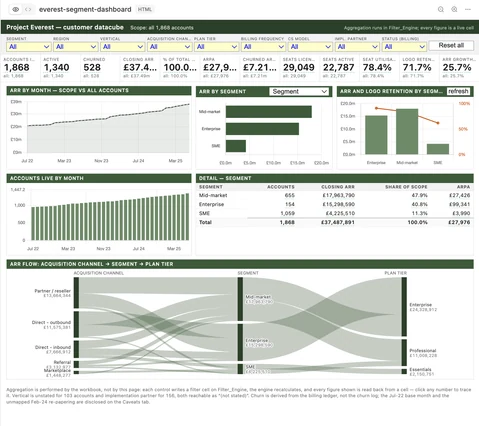
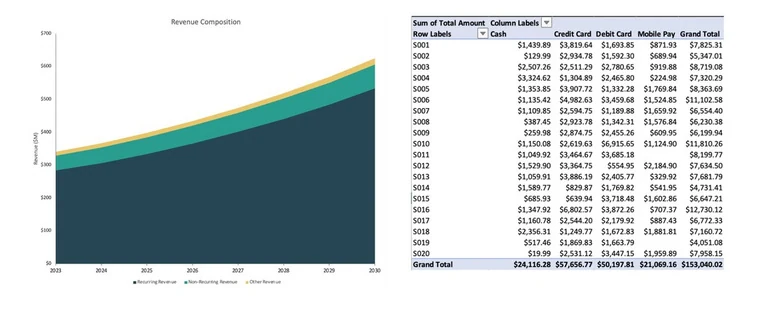
- You can prompt Tracelight to build a wide variety of charts and tables, including with Python and HTML.
B. Export
- To export into another format — like PowerPoint, Word, CSV, or PDF, just prompt Tracelight in the chat.
C. Spreadsheet Apps
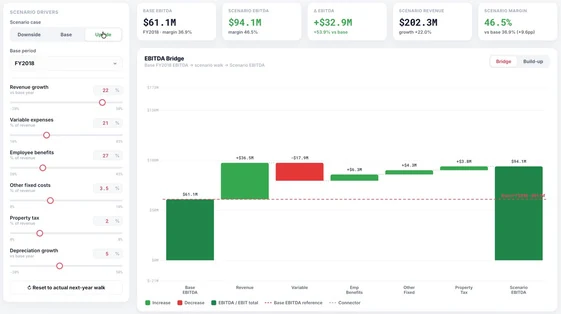
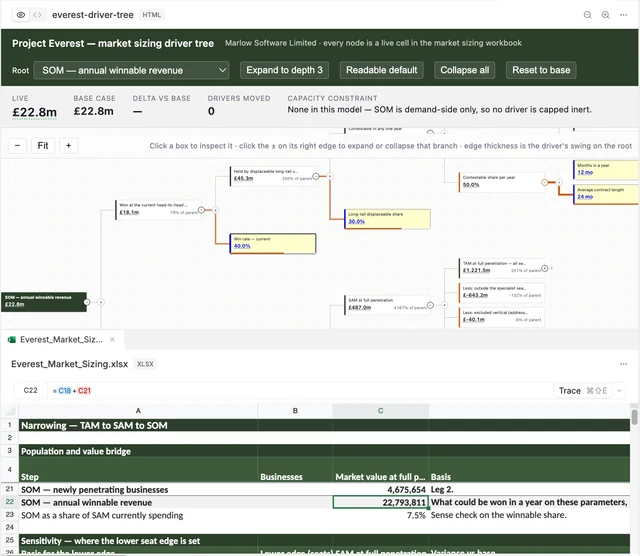
- Build shareable, interactive spreadsheet app deliverables, which calculate live directly from the model as you flex assumptions (without Excel open), ranging from dashboards and driver trees to client-ready reports with interactive scenarios, and more. Click a number in the app to see it cited (see below).